Wednesday, February 20, 2013
Illustrator Diagrams Final
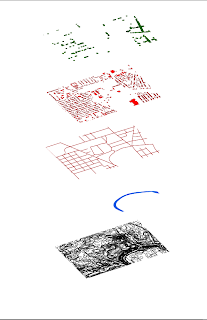
Here are my final diagrams for Unit 5. For this project I used GIS and AI computer programs to create analysis diagrams for the Muncie Fairgrounds. Topics that I presented include Storm Water, Circulation Patterns, Open Spaces, Buildings, Trees, and Wind Patterns. Showing one layer of information has the benefit of displaying specified pieces of information stacked together to create a cohesive analysis of the selected site.
Tuesday, February 19, 2013
Friday, February 15, 2013
Illustrator Diagrams Part 1
Shown here is a set of analytic diagrams created from GIS and then exported into Adobe Illustrator and separated into various layers of information. By transforming the diagrams to have a "staked" look, it organizes the information into layers that are easy to understand. With further practice color and labels can also be added.
Monday, February 11, 2013
Final GIS Maps
The map above displays large majority of Muncie, Indiana. For this map a chose to show my site with a saturated orange / yellow polygon. Other feature that I chose to display were Recreational Facilities, Schools, Trails, Railroads, Roads, Highways, Floodplains, and Wetlands. I used various colors for the transportation (roads, highways, trails, and railroads) to create the hierarchy of transportation throughout Muncie.
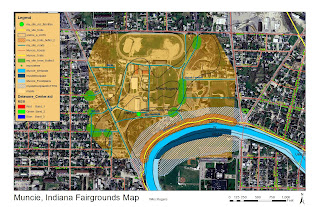
This map displays my site as a closer level for more detailed viewing. Transportation feature that I displayed in this map include trails (with buffer) and roadways. I also included the trees that are located on the site and included a buffer around them. Next I displayed the White River floodplain with buffer on my site. The buffer around objects helps later in the design process to help us understand what should be "left alone" or items that need consideration. Lastly I added in the soil conditions into the site. This helps establish an idea of what can be created on top of the soils listed for this site.
Tuesday, February 5, 2013
Subscribe to:
Posts (Atom)
.jpg)


